
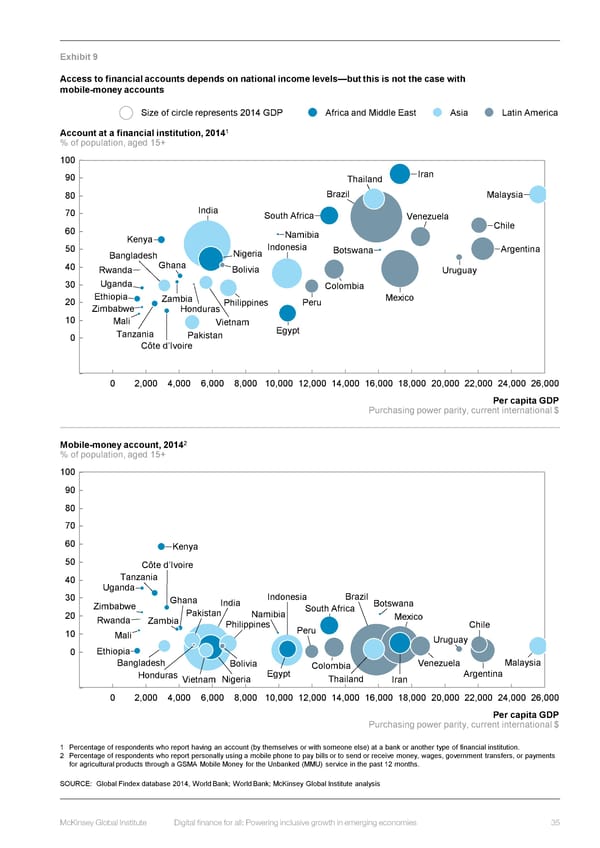
Exhibit 9 Access to financial accounts depends on national income levels—but this is not the case with mobile-money accounts Size of circle represents 2014 GDP Africa and Middle East Asia Latin America 1 Account at a financial institution, 2014 % of population, aged 15+ 100 90 Thailand Iran 80 Brazil Malaysia 70 India South Africa Venezuela 60 Namibia Chile 50 Kenya Indonesia Bangladesh Nigeria Botswana Argentina 40 Rwanda Ghana Bolivia Uruguay 30 Uganda Colombia 20 Ethiopia Zambia Philippines Peru Mexico Zimbabwe Honduras 10 Mali Vietnam 0 Tanzania Pakistan Egypt Côte d’Ivoire 0 2,000 4,000 6,000 8,000 10,000 12,000 14,000 16,000 18,000 20,000 22,000 24,000 26,000 Per capita GDP Purchasing power parity, current international $ 2 Mobile-money account, 2014 % of population, aged 15+ 100 90 80 70 60 Kenya 50 Côte d’Ivoire 40 Tanzania Uganda Brazil 30 Ghana India Indonesia Botswana 20 Zimbabwe Pakistan Namibia South Africa Rwanda Zambia Philippines Mexico Chile 10 Mali Peru Uruguay 0 Ethiopia Bangladesh Bolivia Colombia Venezuela Malaysia Honduras Vietnam Nigeria Egypt Thailand Iran Argentina 0 2,000 4,000 6,000 8,000 10,000 12,000 14,000 16,000 18,000 20,000 22,000 24,000 26,000 Per capita GDP Purchasing power parity, current international $ 1 Percentage of respondents who report having an account (by themselves or with someone else) at a bank or another type of financial institution. 2 Percentage of respondents who report personally using a mobile phone to pay bills or to send or receive money, wages, government transfers, or payments for agricultural products through a GSMA Mobile Money for the Unbanked (MMU) service in the past 12 months. SOURCE: Global Findex database 2014, World Bank; World Bank; McKinsey Global Institute analysis McKinsey Global Institute Digital finance for all: Powering inclusive growth in emerging economies 35
 DIGITAL FINANCE FOR ALL Page 47 Page 49