
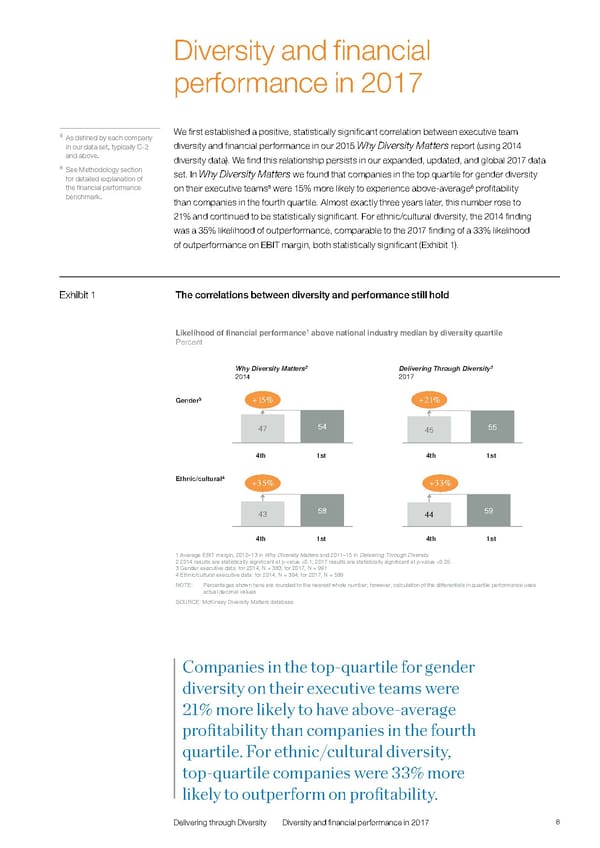
Diversity and financial performance in 2017 5 We first established a positive, statistically significant correlation between executive team As defined by each company in our data set, typically C-2 diversity and financial performance in our 2015 Why Diversity Matters report (using 2014 and above. diversity data). We find this relationship persists in our expanded, updated, and global 2017 data 6 See Methodology section set. In Why Diversity Matters we found that companies in the top quartile for gender diversity for detailed explanation of the financial performance on their executive teams5 were 15% more likely to experience above-average6 profitability benchmark. than companies in the fourth quartile. Almost exactly three years later, this number rose to 21% and continued to be statistically significant. For ethnic/cultural diversity, the 2014 finding was a 35% likelihood of outperformance, comparable to the 2017 finding of a 33% likelihood of outperformance on EBIT margin, both statistically significant (Exhibit 1). Exhibit 1 The correlations between diversity and performance still hold Likelihood of financial performance1 above national industry median by diversity quartile Percent 2 3 Why Diversity Matters Delivering Through Diversity 2014 2017 Gender3 +15% +21% 47 54 45 55 4th 1st 4th 1st Ethnic/cultural4 +35% +33% 43 58 44 59 4th 1st 4th 1st 1 Average EBIT margin, 2010–13 in Why Diversity Matters and 2011–15 in Delivering Through Diversity 2 2014 results are statistically significant at p-value <0.1; 2017 results are statistically significant at p-value <0.05 3 Gender executive data: for 2014, N = 383; for 2017, N = 991 4 Ethnic/cultural executive data: for 2014, N = 364; for 2017, N = 589 NOTE: Percentages shown here are rounded to the nearest whole number; however, calculation of the differentials in quartile performance uses actual decimal values SOURCE: McKinsey Diversity Matters database Companies in the top-quartile for gender diversity on their executive teams were 21% more likely to have above-average profitability than companies in the fourth quartile. For ethnic/cultural diversity, top-quartile companies were 33% more likely to outperform on profitability. Delivering through Diversity Diversity and financial performance in 2017 8
 Delivering Through Diversity Page 9 Page 11