
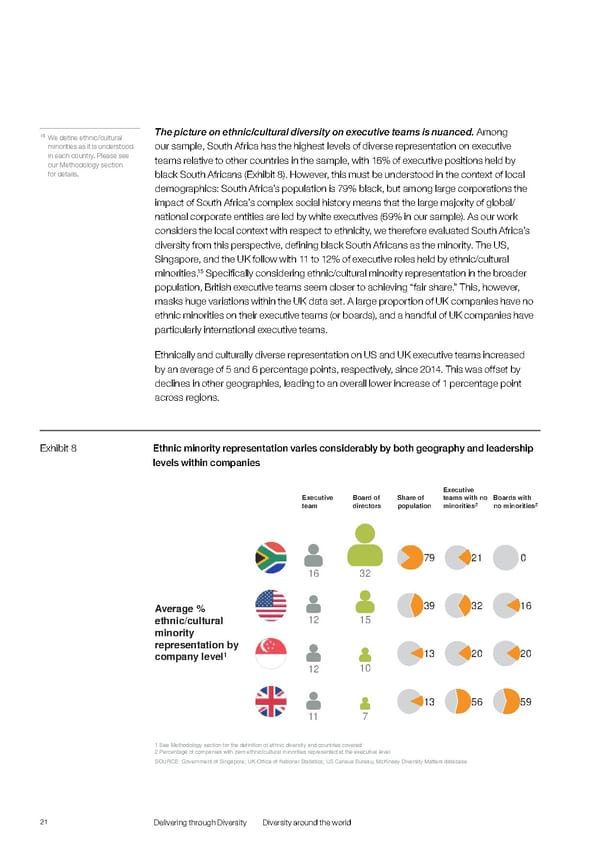
15 The picture on ethnic/cultural diversity on executive teams is nuanced. Among We define ethnic/cultural minorities as it is understood our sample, South Africa has the highest levels of diverse representation on executive in each country. Please see teams relative to other countries in the sample, with 16% of executive positions held by our Methodology section for details. black South Africans (Exhibit 8). However, this must be understood in the context of local demographics: South Africa’s population is 79% black, but among large corporations the impact of South Africa’s complex social history means that the large majority of global/ national corporate entities are led by white executives (69% in our sample). As our work considers the local context with respect to ethnicity, we therefore evaluated South Africa’s diversity from this perspective, defining black South Africans as the minority. The US, Singapore, and the UK follow with 11 to 12% of executive roles held by ethnic/cultural 15 Specifically considering ethnic/cultural minority representation in the broader minorities. population, British executive teams seem closer to achieving “fair share.” This, however, masks huge variations within the UK data set. A large proportion of UK companies have no ethnic minorities on their executive teams (or boards), and a handful of UK companies have particularly international executive teams. Ethnically and culturally diverse representation on US and UK executive teams increased by an average of 5 and 6 percentage points, respectively, since 2014. This was offset by declines in other geographies, leading to an overall lower increase of 1 percentage point across regions. Exhibit 8 Ethnic minority representation varies considerably by both geography and leadership levels within companies Executive Executive Board of Share of teams with no Boards with team directors population minorities2 no minorities2 79 21 0 16 32 Average % 39 32 16 ethnic/cultural 12 15 minority representation by company level1 13 20 20 12 10 13 56 59 11 7 1 See Methodology section for the definition of ethnic diversity and countries covered 2 Percentage of companies with zero ethnic/cultural minorities represented at the executive level SOURCE: Government of Singapore; UK Office of National Statistics; US Census Bureau; McKinsey Diversity Matters database 21 Delivering through Diversity Diversity around the world
 Delivering Through Diversity Page 22 Page 24