
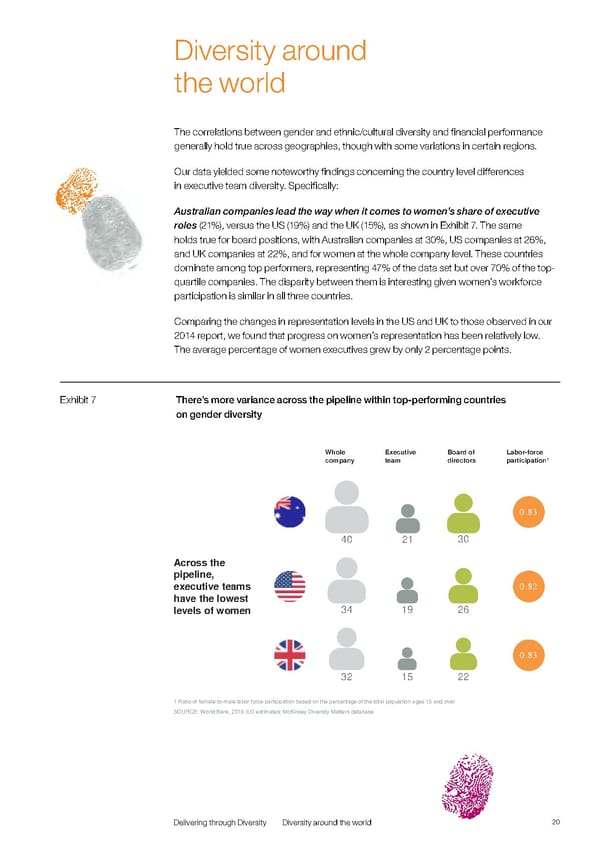
Diversity around the world The correlations between gender and ethnic/cultural diversity and financial performance generally hold true across geographies, though with some variations in certain regions. Our data yielded some noteworthy findings concerning the country level differences in executive team diversity. Specifically: Australian companies lead the way when it comes to women’s share of executive roles (21%), versus the US (19%) and the UK (15%), as shown in Exhibit 7. The same holds true for board positions, with Australian companies at 30%, US companies at 26%, and UK companies at 22%, and for women at the whole company level. These countries dominate among top performers, representing 47% of the data set but over 70% of the top- quartile companies. The disparity between them is interesting given women’s workforce participation is similar in all three countries. Comparing the changes in representation levels in the US and UK to those observed in our 2014 report, we found that progress on women’s representation has been relatively low. The average percentage of women executives grew by only 2 percentage points. Exhibit 7 There’s more variance across the pipeline within top-performing countries on gender diversity Whole Executive Board of Labor-force company team directors 1 participation 0.83 40 21 30 Across the pipeline, executive teams 0.82 have the lowest levels of women 34 19 26 0.83 32 15 22 1 Ratio of female-to-male labor force participation based on the percentage of the total population ages 15 and over SOURCE: World Bank, 2016 ILO estimates; McKinsey Diversity Matters database Delivering through Diversity Diversity around the world 20
 Delivering Through Diversity Page 21 Page 23