
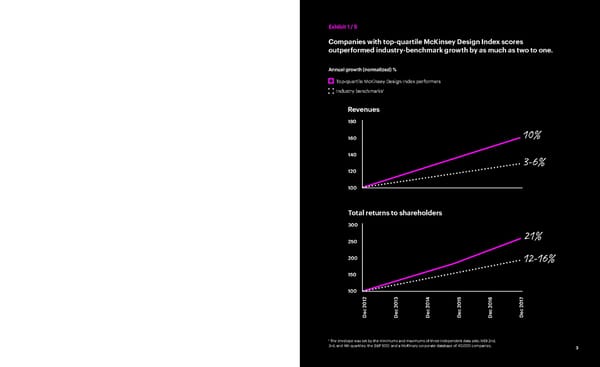
Dec 2012 Dec 2013 Dec 2014 Dec 2015 Dec 2016 Dec 2017 150 100 200 250 300 10% 21% 3-6% 12-16% Exhibit 1 / 5 Companies with top-quartile McKinsey Design Index scores outperformed industry-benchmark growth by as much as two to one. Annual growth (normalized) % Top-quartile McKinsey Design Index performers Industry benchmarks¹ ¹ The envelope was set by the minimums and maximums of three independent data sets: MDI 2nd, 3rd, and 4th quartiles; the S&P 500; and a McKinsey corporate database of 40,000 companies. Total returns to shareholders 120 100 140 160 180 Revenues 3
 The Business Value of Design Page 6 Page 8