
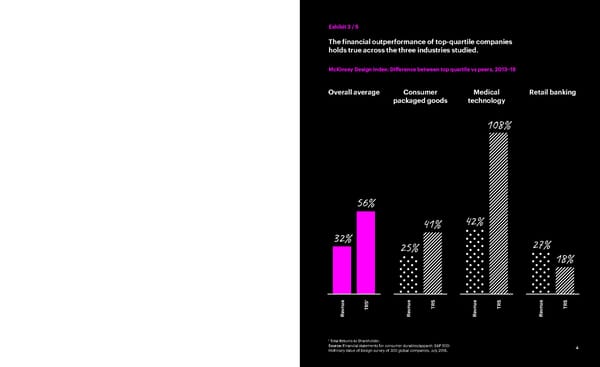
Consumer packaged goods Medical technology Retail banking Overall average McKinsey Design Index: Difference between top quartile vs peers, 2013−18 Revnue Revnue Revnue Revnue TRS1 TRS TRS TRS Exhibit 3 / 5 The financial outperformance of top-quartile companies holds true across the three industries studied. ¹ Total Returns to Shareholder. Source: Financial statements for consumer durables/apparel; S&P 500; McKinsey Value of Design survey of 300 global companies, July 2018. 32% 56% 41% 108% 18% 25% 27% 42% 4
 The Business Value of Design Page 8 Page 10