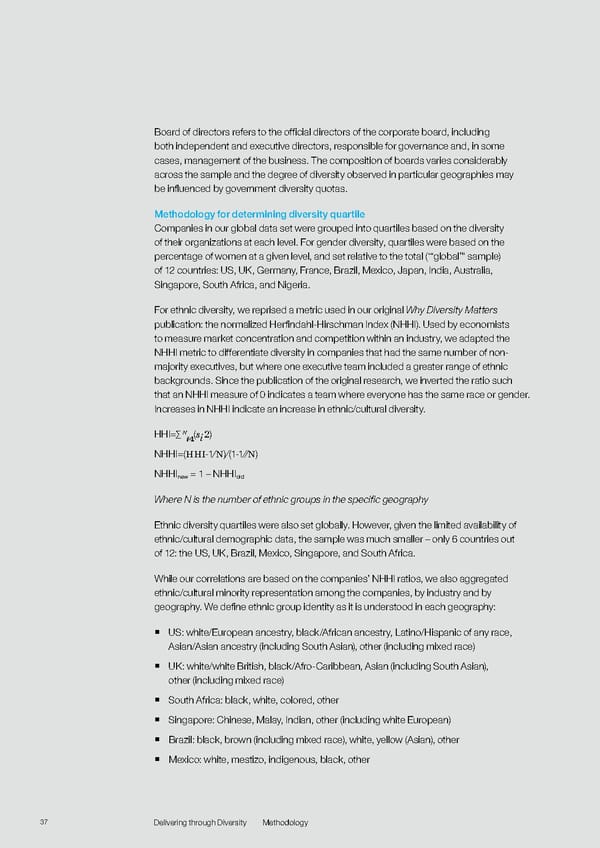
Board of directors refers to the official directors of the corporate board, including both independent and executive directors, responsible for governance and, in some cases, management of the business. The composition of boards varies considerably across the sample and the degree of diversity observed in particular geographies may be influenced by government diversity quotas. Methodology for determining diversity quartile Companies in our global data set were grouped into quartiles based on the diversity of their organizations at each level. For gender diversity, quartiles were based on the percentage of women at a given level, and set relative to the total (‘“global’” sample) of 12 countries: US, UK, Germany, France, Brazil, Mexico, Japan, India, Australia, Singapore, South Africa, and Nigeria. For ethnic diversity, we reprised a metric used in our original Why Diversity Matters publication: the normalized Herfindahl-Hirschman Index (NHHI). Used by economists to measure market concentration and competition within an industry, we adapted the NHHI metric to differentiate diversity in companies that had the same number of non- majority executives, but where one executive team included a greater range of ethnic backgrounds. Since the publication of the original research, we inverted the ratio such that an NHHI measure of 0 indicates a team where everyone has the same race or gender. Increases in NHHI indicate an increase in ethnic/cultural diversity. HHI=∑ N (s 2) i NHHI=(HHI-1∕N)⁄(1-1∕∕N) NHHI = 1 – NHHI new old Where N is the number of ethnic groups in the specific geography Ethnic diversity quartiles were also set globally. However, given the limited availability of ethnic/cultural demographic data, the sample was much smaller – only 6 countries out of 12: the US, UK, Brazil, Mexico, Singapore, and South Africa. While our correlations are based on the companies’ NHHI ratios, we also aggregated ethnic/cultural minority representation among the companies, by industry and by geography. We define ethnic group identity as it is understood in each geography: ƒ US: white/European ancestry, black/African ancestry, Latino/Hispanic of any race, Asian/Asian ancestry (including South Asian), other (including mixed race) ƒ UK: white/white British, black/Afro-Caribbean, Asian (including South Asian), other (including mixed race) ƒ South Africa: black, white, colored, other ƒ Singapore: Chinese, Malay, Indian, other (including white European) ƒ Brazil: black, brown (including mixed race), white, yellow (Asian), other ƒ Mexico: white, mestizo, indigenous, black, other 37 Delivering through Diversity Methodology
 Delivering Through Diversity Page 38 Page 40